반응형
vue-chartjs와 chart.js를 이용하여 그린 도넛 차트에 그림자를 넣어보겠습니다.
(vue 2 버전, chart.js: 3.5.0, vue-chartjs: 3.5.1 버전 사용)
1. 도넛차트 그리기
https://nm-it-diary.tistory.com/88
[Vue.js] Chart.js Doughnut Chart 그리기
vue-chartjs와 chart.js를 이용하여 도넛차트를 그려보겠습니다. (vue 2 버전, chart.js: 3.5.0, vue-chartjs: 3.5.1 버전 사용) 1. vue-chartjs, chart.js 다운로드 npm install chart.js npm install vue-chartj..
nm-it-diary.tistory.com
2. 그림자 넣는 코드
2-1. DoughnutChart.vue
    .
    .
options: {
    .
    .
    shadow: {
      id: "doughnut"
    }
    .
    .
- options에 shadow라는 객체를 생성하고, id를 "doughnut"으로 줬습니다.
- 만약 여러 차트를 그려야 한다면 이와 같이 아래 조건문에 쓰일 옵션을 만들어 사용하면 됩니다.
2-2. global.js
import { Chart, registerables } from "chart.js";

const plugin = {
  id: "shadow-plugin",
  beforeDraw: function(chart) {
    if (chart.config._config.options?.shadow?.id === "doughnut") {
      var ctx = chart.ctx;

      chart.data.datasets.forEach(set => {
        const _fill = ctx.fill;
        ctx.fill = function() {
          ctx.save();
          ctx.shadowColor = "rgba(2, 35, 68, 0.05)";
          ctx.shadowBlur = 2;
          ctx.shadowOffsetY = 5;
          _fill.apply(this, arguments);
          ctx.restore();
        };
      });
    }
  }
};

Chart.register({ plugin });
Chart.register(...registerables);
- 그림자를 넣는 코드를 plugin에 넣고 register 해줍니다.
3. 결과 화면
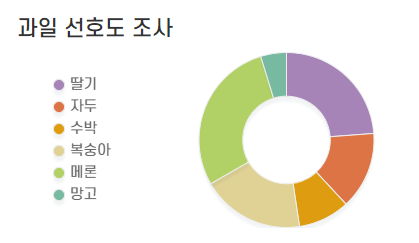
이상으로 Chart.js 도넛차트에 그림자를 넣는 코드를 알아보았습니다.
반응형
'Web Developer's Story > VUE.js' 카테고리의 다른 글
| [Vue.js] virtual keyboard - Simple-keyboard 사용법 (1) | 2022.01.05 |
|---|---|
| [Vue.js] Chart.js Line Chart 그리기 (0) | 2021.12.28 |
| [Vue.js] Chart.js Doughnut Chart labels outside with line (0) | 2021.11.03 |
| [Vue.js] Chart.js Doughnut Chart 그리기 (0) | 2021.09.09 |
| [Vue.js] 뷰 프레임워크 기본개념 및 환경설정 (0) | 2021.09.07 |