vue-chartjs와 chart.js를 이용하여 라인차트를 그려보겠습니다.
(vue 2 버전, chart.js: 3.5.0, vue-chartjs: 3.5.1 버전 사용)
1. vue-chartjs, chart.js 다운로드
npm install chart.js
npm install vue-chartjs chart.js --save
2. 라인차트 개발 문서(3.5.0 version)
https://www.chartjs.org/docs/3.5.0/charts/line.html
Line Chart | Chart.js
Line Chart A line chart is a way of plotting data points on a line. Often, it is used to show trend data, or the comparison of two data sets. const config = { type: 'line', data: data, };const config = { type: 'line', data: data, }; const labels = Utils.mo
www.chartjs.org
3. 라인차트 구현
3-1. global.js
import { Chart, registerables } from "chart.js";

Chart.register(...registerables);
- 여러 차트와 공유할 수 있는 파일을 global.js로 만들었습니다.
3-2. lineChart.js
import "@/utils/charts/global";
import { Line } from "~/vue-chartjs-3.5.1/src/index";

export default {
  extends: Line,
  props: ["chartData", "options"],
  mounted() {
    this.renderChart(this.chartData, this.options);
  }
};
- 저는 vue-chartjs를 외부 파일로 넣어서 사용했습니다.
- vue 파일에서 설정한 데이터와 옵션을 가지고 차트를 그리는 코드입니다.
3-3. LineChart.vue
<template>
  <div>
    <line-chart
      ref="lineChart"
      :chartData="chart.data"
      :options="chart.options"
      id="chart"
    ></line-chart>
  </div>
</template>
import LineChart from "~/lineChart.js";
export default {
name: "line-chart",
type: "line",
components: {
LineChart
},
data() {
return {
chart: {
data: {
labels: [2014, 2015, 2016, 2017, 2018, 2019, 2020, 2021, 2022, 2023],
datasets: [
{
label: "인원수",
backgroundColor: "rgb(255,153,204, 0.5)",
pointBackgroundColor: "hotpink",
fill: true,
tension: 0.1,
borderColor: "hotpink",
pointBorderColor: "hotpink",
borderWidth: 1,
pointBorderWidth: 1,
data: [450, 300, 100, 1000, 750, 600, 900, 1500, 1200, 2000]
}
]
},
options: {
plugins: {
legend: {
display: true,
position: "left",
labels: {
boxWidth: 8,
padding: 10,
usePointStyle: true,
pointStyle: "circle",
font: {
size: 14
}
},
fullSize: true,
align: "center"
},
tooltip: {
boxWidth: 15,
bodyFont: {
size: 14
}
}
},
scales: {
x: {
grid: {
display: false
},
ticks: {
padding: 3
}
},
y: {
ticks: {
callback: (val, index) => {
return val !== 0 ? val.toString().replace(/\B(?=(\d{3})+(?!\d))/g, ",") : "";
},
padding: 10
},
grid: {
drawBorder: false,
color: "#323232",
lineWidth: 1
}
}
},
responsive: true,
maintainAspectRatio: false,
animation: {
duration: 5000
}
}
}
};
}
- 위 코드의 옵션들에 대한 설명은 2번 링크를 이용하면 볼 수 있습니다.
- 보여지는 데이터는 왼쪽에서 오른쪽 순서로 보여집니다.
4. 결과 화면
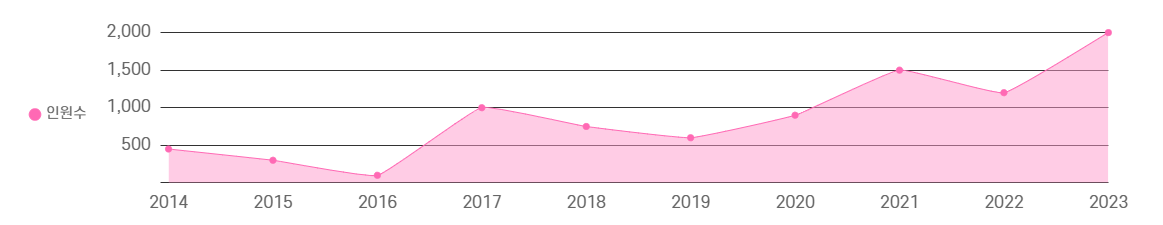
이상으로 뷰에서 Chart.js를 사용하여 라인차트를 그려보았습니다.
'Web Developer's Story > VUE.js' 카테고리의 다른 글
| [Vue.js] Chart.js Bar Chart 그리기 (0) | 2022.03.15 |
|---|---|
| [Vue.js] virtual keyboard - Simple-keyboard 사용법 (1) | 2022.01.05 |
| [Vue.js] Chart.js Doughnut Chart labels outside with line (0) | 2021.11.03 |
| [Vue.js] Chart.js Doughnut Chart 그림자 넣기 (0) | 2021.09.13 |
| [Vue.js] Chart.js Doughnut Chart 그리기 (0) | 2021.09.09 |